The Best Free Data Analysis Tools in 2025
If you’re stepping into the world of data—whether as a student, analyst, startup founder, or small business owner—you don’t need expensive software to begin. In 2025, the ecosystem of free (or freemium) data tools is richer than ever. These platforms and libraries allow you to clean, analyze, visualize, and even model data without paying upfront. Below are some of the top free data analysis tools you should try this year.
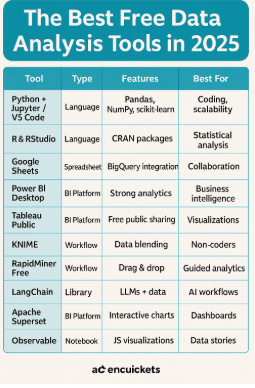
1. Python + Jupyter / VS Code (with pandas, NumPy, scikit-learn)
- What it is: A programming environment enriched with powerful libraries.
- Why use it: It’s highly flexible, customizable, and open source. With pandas for data manipulation, NumPy for arrays, scikit-learn for modeling, and Jupyter notebooks or VS Code for interactive work—you get a full stack.
- Best for: Users comfortable coding and those who want ultimate control and scalability.
2. R & RStudio
- What it is: A language and environment built for statistical computing and graphics.
- Why use it: R’s ecosystem includes CRAN packages like
ggplot2,tidyverse,caret, andshiny, letting you go from raw data to dashboards with relative ease. - Best for: Statistical analysis, academic work, bioinformatics, and users wanting strong community support.
3. Google Sheets + Connected Tools (Sheets, BigQuery Sandbox)
- What it is: A cloud spreadsheet that integrates with Google’s data infrastructure.
- Why use it: For many small datasets, Sheets is enough. And with the BigQuery sandbox and data connectors (e.g., connected sheets), you can query large data sources too.
- Best for: Collaborative work, light analytics, prototyping dashboards, and teams working with Google Workspace.
4. Power BI Desktop (Free version)
- What it is: Microsoft’s powerful business intelligence tool with a free desktop edition.
- Why use it: Drag-and-drop interface, robust visualization options, and ability to connect to many data sources. You only need to pay if you need sharing/collaboration in the cloud.
- Best for: Analysts who want strong analytics without full coding.
5. Tableau Public
- What it is: A free version of Tableau for public dashboards.
- Why use it: You get Tableau’s world-class visualization tools. The tradeoff: dashboards are hosted publicly (visible to all).
- Best for: Portfolio work, public blogs, teaching, and sharing insights openly.
6. KNIME Analytics Platform
- What it is: A free data workflow tool where you build analysis pipelines visually.
- Why use it: No-code setup, modular nodes for ETL, modeling, and data blending.
- Best for: Users who prefer visual workflows over writing code, and who need to integrate multiple data sources.
7. RapidMiner Free (Community Edition)
- What it is: A free version of a popular data science tool.
- Why use it: Offers drag-and-drop operations for data prep, modeling, evaluation, and deployment (with some limitations).
- Best for: Beginners in predictive modeling who want a guided experience.
8. LangChain (Community + OpenAI API)
- What it is: A library for developing applications with large language models and data workflows.
- Why use it: Particularly strong in combining text, data, and reasoning. Useful when exploring integration of generative AI and data analytics.
- Best for: Experimentation, building prototypes that combine analysis and narrative insight.
9. Apache Superset
- What it is: Open source data exploration and visualization platform.
- Why use it: You can connect to databases, slice and dice your data, and create dashboards all free.
- Best for: Teams deploying data dashboards open-source style, especially in self-hosted or cloud setups.
10. Observable & Observable Plot
- What it is: A notebook-like JavaScript environment for data visualization and interactive exploration.
- Why use it: Great for web-based interactive visuals, embedding in blogs, and combining computation + narrative.
- Best for: Data story tellers, visualization creatives, web developers.
How to Choose (Your Personal Checklist)
| Factor | What to Consider |
|---|---|
| Learning curve | Code-based (Python, R) vs visual (Power BI, KNIME) |
| Scalability | Tools must handle your dataset size |
| Sharing & collaboration | Does it support sharing dashboards, embedding, or team use? |
| Extensions & community | Active libraries, plugins, and tutorials |
| Deployment path | Ability to move from local to production or cloud later |
Final Thoughts
Free doesn’t mean inferior. In 2025, the top free data tools offer serious power. Whether you lean toward coding, visual analytics, or hybrid workflows, there’s a tool ready for your needs. Start small—pick one or two—and build experience. Over time, you’ll know when a paid plan or enterprise solution may make sense. But until then, these tools let you experiment, learn, and drive insights at no cost.
To Run Analysis, visit https://analysis.africa NOW!